Story Time: Kunal’s Bakery
Hey kids! Let’s learn why organising information is important?
- Once upon a time, in a town filled with sweet smells and delicious treats, there was a bakery owned by a kind man named Kunal.
- He had so many different types of cakes and desserts in his shop, from chocolate cakes to strawberry tarts.

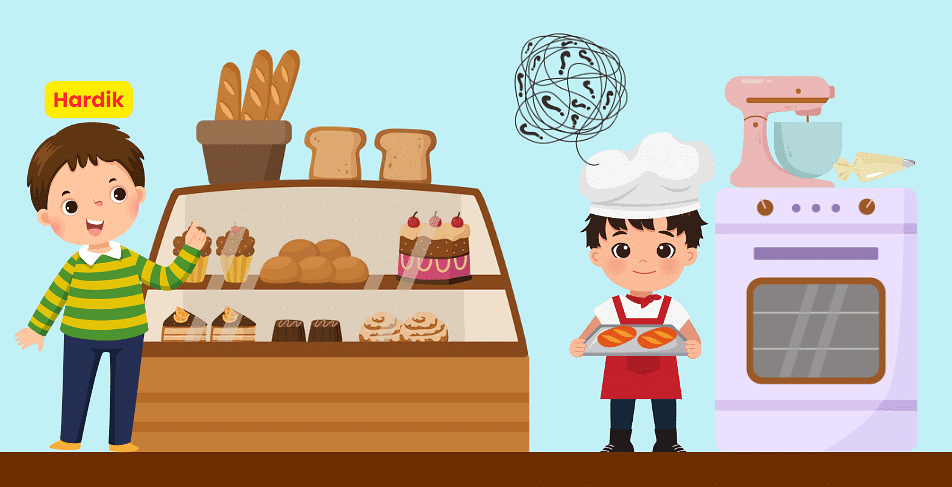
- One sunny day, a customer named Hardik visited Kunal’s bakery.
- Hardik wanted to buy all the yummy desserts, but he needed to know how many of each type were available.
- Kunal tried to count, but it was a bit tricky.
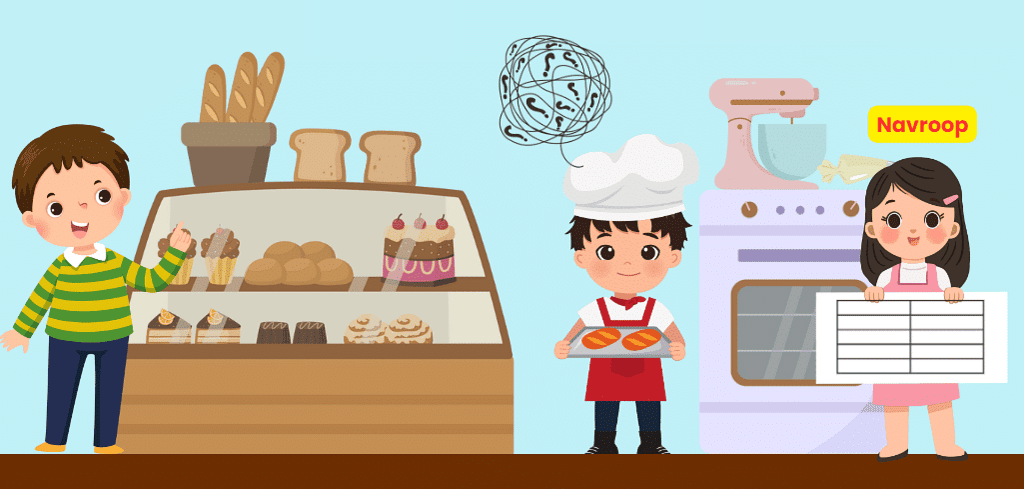
- That’s when Kunal called his smart friend Navroop for help.
- Navroop had a clever idea. She took out a piece of paper and made a table with the names of all the desserts.
- Then, together with Kunal, they counted how many of each dessert they had and filled in the table.
- For example, if there were 1 strawberry cake, they wrote ‘1’ in the column next to ‘Strawberry Cake.’
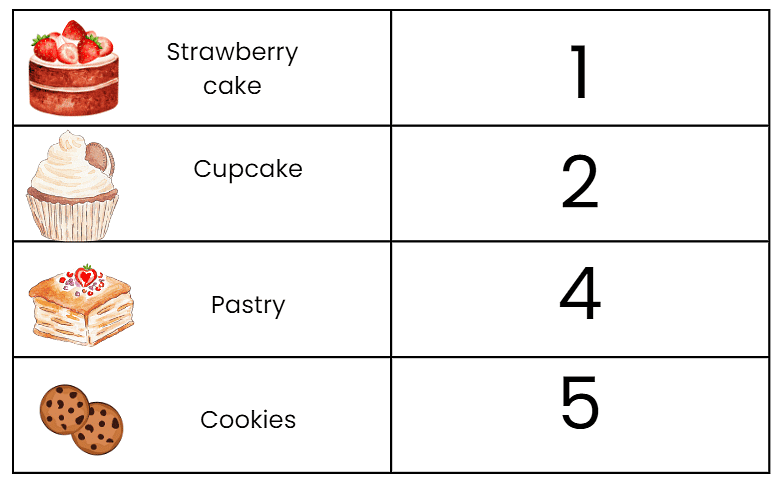
- This table helped them organize all the data and also made it easy to create the final bill for Hardik.
- And that’s how Kunal and Navroop learned the importance of organizing data, which is what data handling is all about!
Data handling is about organizing information systematically, like arranging books on a shelf by genre, making it easier to understand and use through tables, charts, and graphs.
What is Data?
- Data is like pieces of information, such as numbers, words, or observations, that we collect and use to learn things or make decisions.
- It is very important and useful to organise data. there are several ways to organise data.
Let’s now understand different ways of organising data.
Tables
- Tables are like organized lists with rows and columns where we can write down information neatly.
- They help us keep track of things and compare different pieces of information easily.
- In the above story, Kunal and Navroop used a table to organise their data.
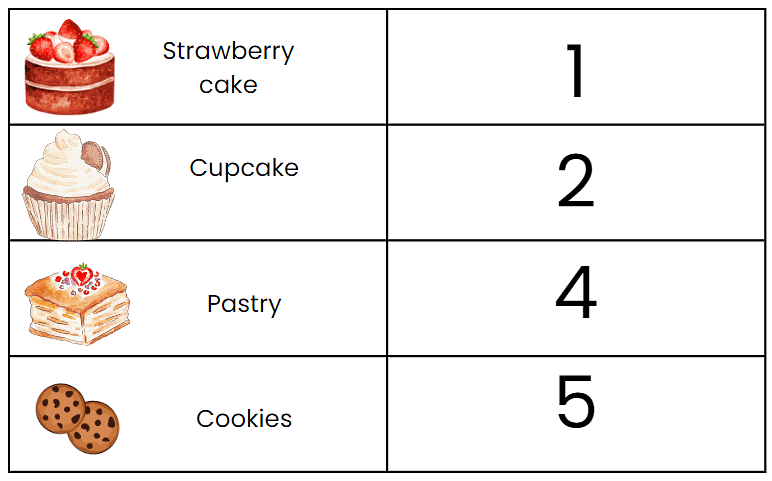
Table made by Kunal & Navroop
Let’s now Practice making a table with Shankar.
Learn by Practicing: Shankar’s Button Collection Adventure- 1
Once upon a time, there was a curious boy named Shankar who loved collecting buttons of different colors and sizes.
- One fine day, as he sat admiring his collection, he decided it was time to organize them properly.
Step 1: Shankar took out a piece of paper and drew a table with columns for colors and rows for types of buttons.
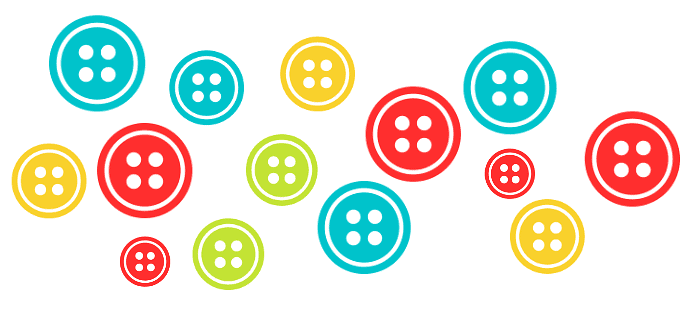
Step 2: He carefully listed down all the colours of buttons he had, like blue, yellow, red, and green.
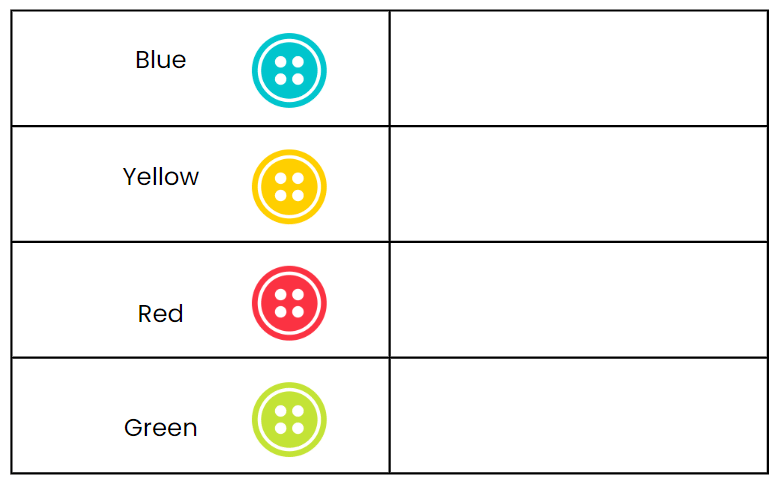
Table Made by Shankar
Step 3: Shankar then started counting each type of button. He counted:
- 4 blue buttons
- 3 yellow buttons
- 5 red buttons
- 2 green buttons
Table filled by Shankar
Excitedly, he filled in the table with the number of buttons for each colour.
By organizing his button collection on a table, Shankar could easily see how many buttons he had of each colour, making it fun and simple to manage his treasured collection!
Now that we know how tables help us, Let’s move on to charts.
Charts
Charts are like colourful pictures that show information in a fun way, like how many friends like different colours. They help us see patterns and understand numbers easily, like counting how many red, blue, or green buttons we have in a collection.
Learn by Practicing: Shankar’s Button Collection Adventure- 2When Shankar showed his table to his friend Richa, she smiled and said, “Tables are great, but charts are even more fun! Let’s turn your button collection into a colourful chart!”
Richa & Shankar
- Excited by Richa’s idea, Shankar took out a big piece of paper and drew a beautiful chart with colourful columns for each type of button colour: blue, yellow, red, and green.
- He counted the buttons again and placed colourful stickers on the chart to represent each colour.
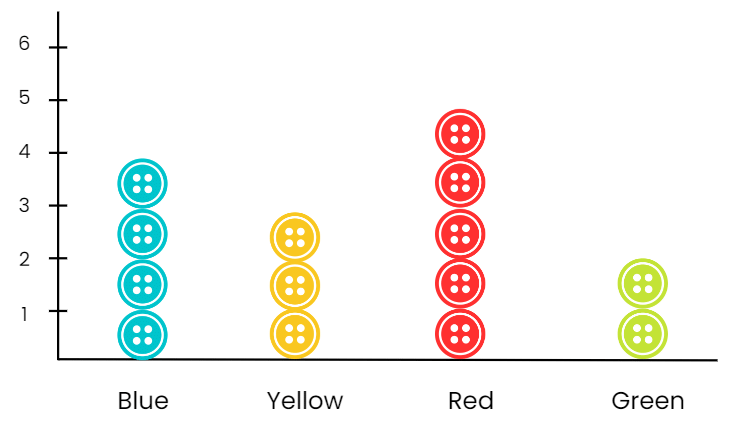
- As Shankar stepped back to admire his button chart, he realized that Richa was right.
- The chart made it so easy to see which colour had the most buttons and which had the least.
- It was like turning his collection into a colourful work of art that also helped him understand his buttons better!
Isn’t it amazing how organizing information can make things so much easier? Just like Kunal and Navroop organized their dessert data in a table and Shankar used both tables and charts to organize his button collection, we can also organize information to understand it better.
Remember, data can be like a puzzle, and tables and charts are like tools that help us solve that puzzle and see the bigger picture. So, the next time you have a lot of information to manage, think about how you can use tables and charts to make it simpler and more fun! Happy organizing!