Q1: The pictograph given below shows preference of the students for winter activities:
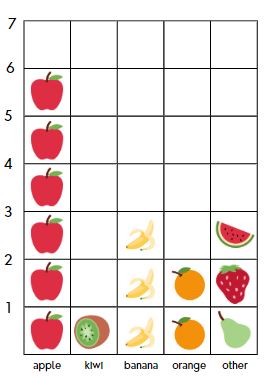
Answer the following questions:
(i) How many more apples are there than bananas on the graph?
There are 6 apples and 3 bananas.
Difference: 6 – 3 = 3
Answer: 3 more apples than bananas.
(ii) If each fruit represents 2 actual fruits, how many real oranges are there?
There are 2 oranges on the graph, and each represents 2 fruits.
Total real oranges: 2 x 2 = 4
Answer: 4 real oranges.
(iii) What is the total number of fruits on the graph?
Apples: 6
Kiwis: 1
Bananas: 3
Other: 3
Total fruits: 6 + 1 + 3 + 2 + 3 = 15
Answer: 15 fruits.
(iv) Which category has the second highest number of fruits?
Apples: 6 (highest)
Others and banana: 3 (second highest)
Answer: The “other” category has the second highest number of fruits.
(v) How many fruits are there in the “other” category compared to kiwis?
Other: 3 fruits
Kiwis: 1 fruit
Difference: 3 – 1 = 2
Answer: 2 more fruits in the “other” category than kiwis.
(vi) If you add two more oranges to the graph, how many fruits will there be in total?
Current total: 15 fruits
Adding 2 more oranges: 15 + 2 = 17
Answer: 17 fruits in total.
Q2: The total number of animals in five villages are given below:
Draw a pictograph to represent the above data.
Ans: Each circle represents 10 animals
Q3: The modes of traveling to school by the students of a class are given below:
Draw a pictograph to represent the above data.
Ans: 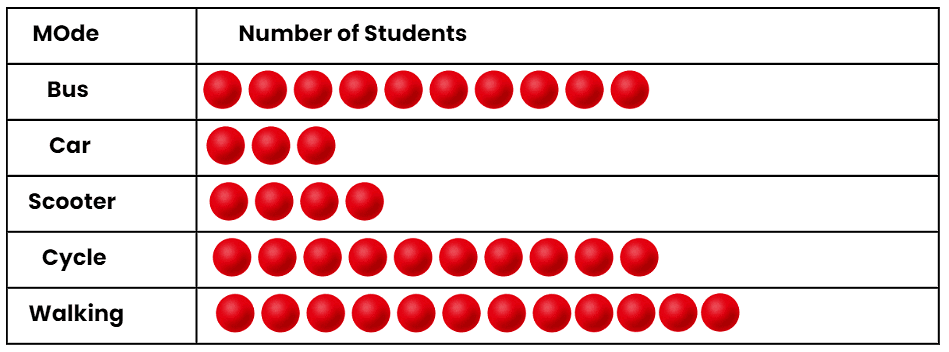
Look at the pictograph and answer the following questions:
(i) How many candles are brought by Daksh? ______.
Ans: 3 x 4 = 12.
(ii) Who has brought the maximum number of candles and how many? ______.
Ans: 10 x 4 = 40.
(iii) How many candles are brought by Anshu? ______.
Ans: 8 x 4 = 32.
(iv) Name the two students who have brought the same number of candles.
Ans: Neha and Ridhima.
Q5: The different types of trees planted in a park are given below:
Draw a pictograph to represent the above data.
Ans:
Q6: The sale of toys in a toy shop during the weekdays of a particular week is given below. Draw a pictograph to represent the following data.
Each circle represents 4 toys
Ans: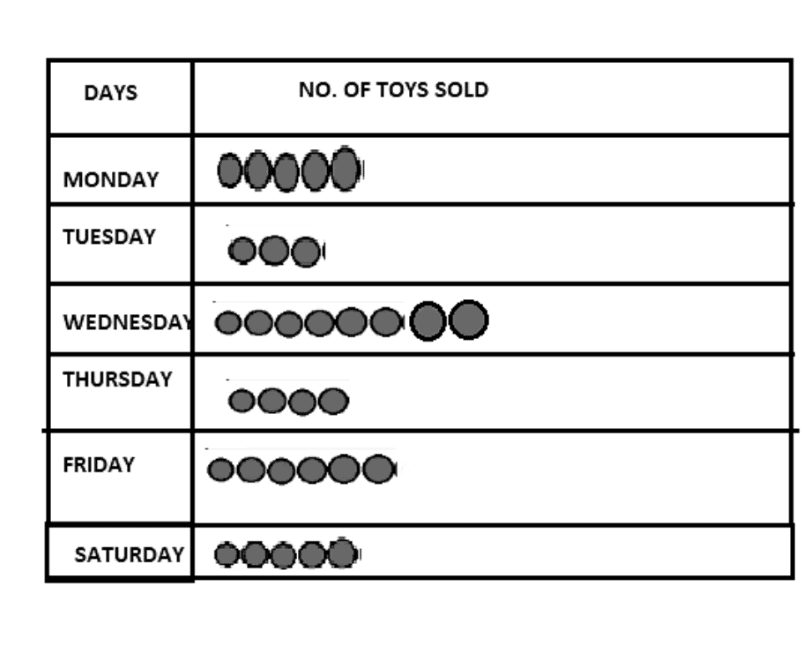
Q7: The following bar graph shows favourite colour of students of class IV.
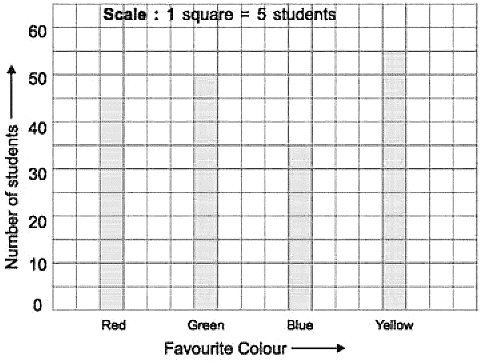
Look at the bar graph and answer the following:
(i) How many children like green colour?
Ans: 50
(ii) Which is the most favourite colour of the students of class IV?
Ans: Yellow
Q8: The following bar graph shows the favourite picnic spots of children of a class. Look at the bar graph and choose the correct answer:
(i) Which destination is liked by maximum number of children?
Ans: Adventure island
(ii) How many children would like to go to Adventure island?
Ans: 30
(iii) How many children would like to go to Rail Museum?
Ans: 15
Q9: The bar graph shown below represents marks obtained by Abhijit. Look at the bar graph and answer the following questions:
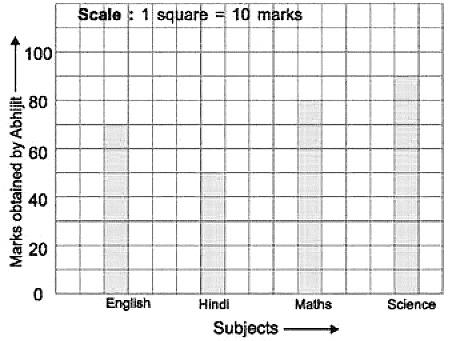
(i) Find the total marks obtained by him out of 400.
Ans: = 70 + 50 + 80 + 90 = 290
(ii) In which subject Abhijit got the highest marks?
Ans: Science
(iii) In which subject Abhijit got the lowest marks?
Ans: Hindi
Q10: The bar graph shown here represents different means of transport used by students of class IV-A to come to school.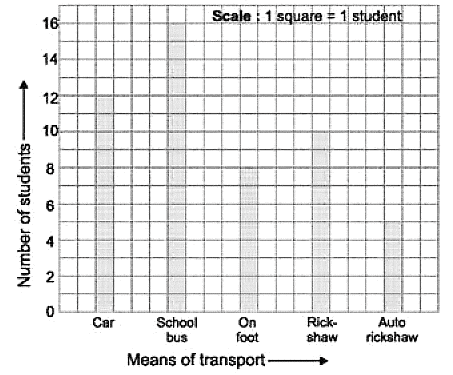
Study the bar graph and answer the following questions.
(i) How many students come to school by autorickshaw?
Ans: 5
(ii) How many students come to school by car?
Ans: 12
(iii) Which mode of transport is used by maximum number of students?
Ans: School bus.