Q1: For a particular year, following is the distribution of ages (in years) of primary school teachers in a district :
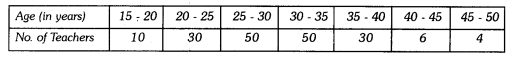
(i) Write the lower limit of first class interval.
(ii) Determine the class limits of the fourth class interval.
(iii) Find the class mark of the class 45 – 50.
(iv) Determine the class size.
Ans:
(i) First class interval is 15 – 20 and its lower limit is 15.
(ii) Fourth class interval is 30 – 35.
Lower limit is 30 and upper limit is 35.
(iii) Class mark of the class 45 – 50 = (45 + 50) / 2 = 95 / 2 = 47.5.
(iv) Class size = Upper limit of each class interval – Lower limit of each class interval.
∴ Here, class size = 20 – 15 = 5.
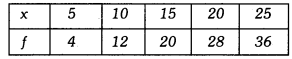
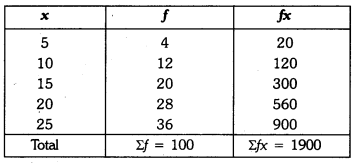
Q2: Find the mean of the following distribution :
Ans:
Now,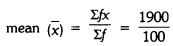
Explanation: Use the formula mean = Σ(f × x) / Σf, where f is frequency and x is class mark. The required values of Σ(f × x) and Σf are shown in the calculation above. Substituting these values gives the mean = 19.
Q3: In figure, there is a histogram depicting daily wages of workers in a factory. Construct the frequency distribution table.
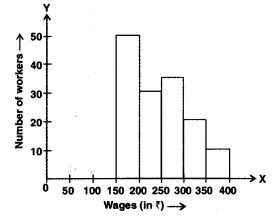
Ans:
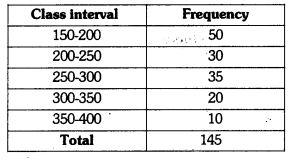
Explanation: The frequency distribution table is obtained by reading the class intervals and the heights of the bars from the histogram. The table constructed from the given histogram is shown above.
Q4: Ten observations 6, 14, 15, 17, x + 1, 2x – 13, 30, 32, 34, 43 are written in ascending order. The median of the data is 24. Find the value of x.
Ans:
Here, the arranged data is 6, 14, 15, 17, x + 1, 2x – 13, 30, 32, 34, 43.
Total number of observations = 10.
For an even number (10) of observations, the median is the average of the 5th and 6th observations.
5th observation = x + 1
6th observation = 2x – 13
Therefore, (x + 1 + 2x – 13) / 2 = 24
⇒ (3x – 12) / 2 = 24
⇒ 3x – 12 = 48
⇒ 3x = 60
⇒ x = 20.
∴ The value of x = 20.
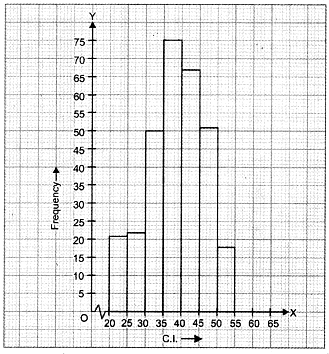
Q5: Draw a histogram for the given data :
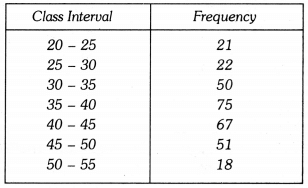
Ans:
Let us represent class-intervals along x-axis and corresponding frequencies along y-axis on
a suitable scale. For each class interval draw a rectangle whose base is the class width and whose height is the frequency (or frequency density if class widths differ). The required histogram is as under :
Q6: Given are the scores (out of 25) of 9 students in a Monday test :
14, 25, 17, 22, 20, 19, 10, 8 and 23
Find the mean score and median score of the data.
Ans: Ascending order of scores is :
8, 10, 14, 17, 19, 20, 22, 23, 25.
Mean score:
Sum of scores = 8 + 10 + 14 + 17 + 19 + 20 + 22 + 23 + 25 = 158.
Number of students = 9.
Mean = Sum / Number = 158 / 9 = 17.555… ≈ 17.56 marks.
Median score:
Since there are 9 (odd) observations, the median is the 5th value in the ordered list.
5th value = 19.
∴ Median = 19 marks.
Q7: Draw a histogram of the weekly pocket expenses of 125 students of a school given below :
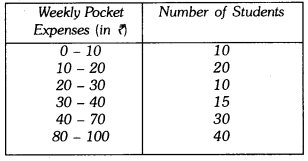
Ans: Here, the class sizes are different, so calculate the frequency density (adjusted frequency) for each class by using the formula:
frequency density = frequency/class width.
Alternatively, if you wish to scale densities to the smallest class width (here minimum class width = 10), you may use:
adjusted frequency = frequency × (Minimum class size/class width).

Here, the minimum class size = 10 – 0 = 10.
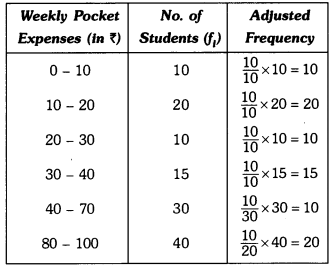
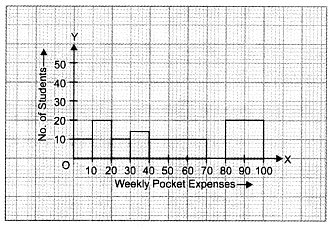
Let us represent weekly pocket money along x-axis and corresponding frequency densities (or adjusted frequencies) along y-axis on a suitable scale. The required histogram using these densities is given below :
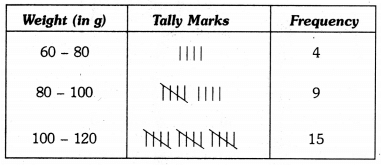
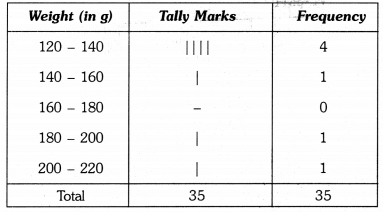
Q8: The weight in grams of 35 mangoes picked at random from a consignment are as follows:
131, 113, 82, 75, 204, 81, 84, 118, 104, 110, 80, 107, 111, 141, 136, 123, 90, 78, 90, 115, 110, 98, 106, 99, 107, 84, 76, 186, 82, 100, 109, 128, 115, 107, 115 From the grouped frequency table by dividing the variable range into interval of equal width of 20 grams, such that the mid-value of the first class interval is 70 g. Also, draw a histogram.
Ans:
It is given that the size of each class interval = 20 and the mid-value of the first class interval is 70.
Let the lower limit of the first class interval be a, then its upper limit = a + 20.
Mid-value of first interval = (a + a + 20) / 2 = a + 10 = 70 …………..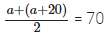
⇒ a = 70 – 10 = 60.
Thus, the first class interval is 60 – 80 and the other class intervals are 80 – 100, 100 – 120, 120 – 140, 140 – 160, 160 – 180, 180 – 200 and 200 – 220.
So, the grouped frequency table formed by counting the number of mango weights falling in each interval is as under :
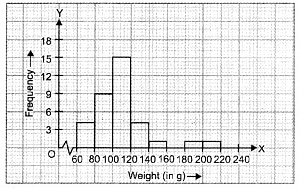
Let us represent weight (in g) along x-axis and corresponding frequencies along y-axis on a suitable scale. The required histogram is as under :
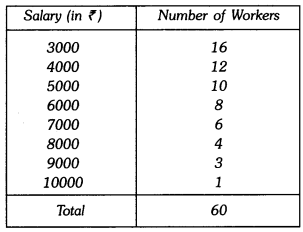
Q9: Find the mean salary of 60 workers of a factory from the following table :
Ans:
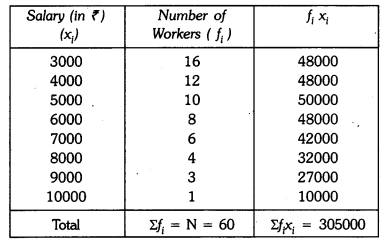
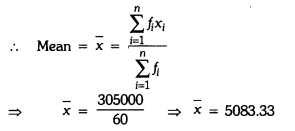
Explanation: Use the formula mean = Σ(f × x) / Σf, where x is the class mark and f the frequency. The table above shows the class marks, f, and f × x values. Summing these gives Σf = 60 and Σ(f × x) = 304,999.8 (as computed in the table). Therefore mean salary = Σ(f × x) / Σf = 304,999.8 / 60 = ₹5,083.33.
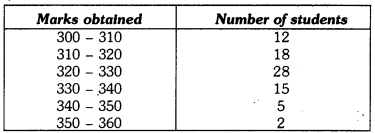
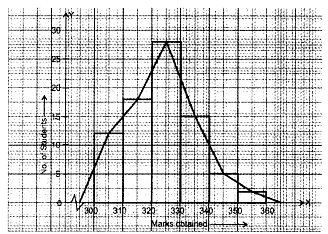
Q10: In a school marks obtained by 80 students are given in the table. Draw a histogram. Also, make frequency polygon.
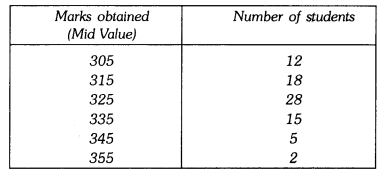
Ans:
∴ Lower limit of first class interval is 305 – 10/2 = 300.
Upper limit of first class interval is 305 + 10/2 = 310.
Thus, first class interval is 300 – 310.
Required histogram and frequency polygon are drawn on graph paper as shown below:
Q11: The following two tables gives the distribution of students of two sections according to the marks obtained by them :
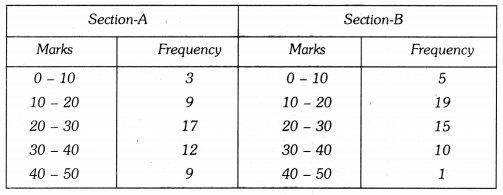
Represent the marks of the students of both the sections on the same graph by two frequency polygons. From the two polygons compare the performance of the two sections.
Ans:
The class marks are as under :
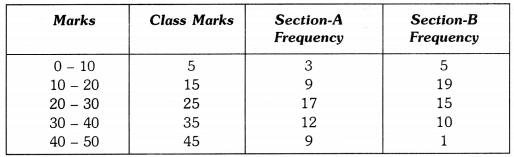
Let us take class marks on X-axis and frequencies on Y-axis. To plot frequency polygon of Section-A, plot the points (5, 3), (15, 9), (25, 17), (35, 12), (45, 9) and join these points by straight line segments. To plot frequency polygon of Section-B, plot the points (5, 5), (15, 19), (25, 15), (35, 10), (45, 1) on the same scale and join these points by dotted line segments.
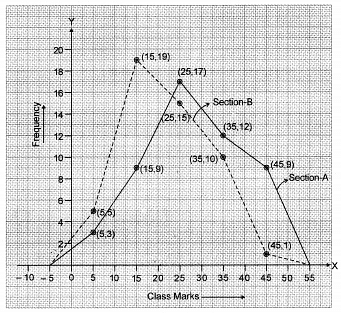
From the two polygons, Section A’s polygon lies above Section B’s polygon for most of the middle and higher class marks. This indicates that Section A has more students scoring in the middle and higher ranges compared with Section B; hence, overall performance of Section A is better.