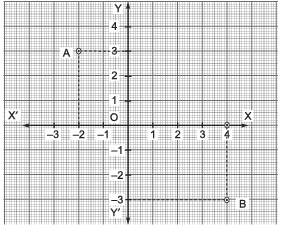
1. In the following figure, what are the coordinates of: (i) A, (ii) B, (iii) origin?
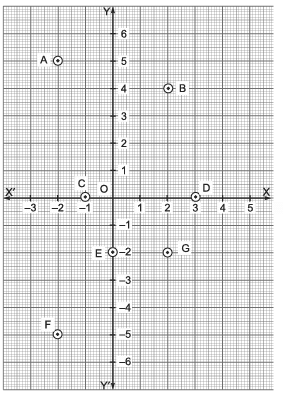
2. Write the abscissa of the following points: (4, 0), (5, –3), (–3, 4) and (0, –4) 3. Fill in the blanks Based on the above cartesian planes: (i) The co-ordinates of point A are ……….. (ii) The co-ordinates of point B are ……….. (iii) The co-ordinates of point C are ……….. (iv) The co-ordinates of point D are ……….. (v) The co-ordinates of point E are ……….. (vi) The co-ordinates of point F are ……….. (vii) The co-ordinates of point G are ………..
4. Three vertices of a rectangle are (3, 2), (–6, 2) and (–6, 5). Plot these points and find the co-cordinates of the fourth vertex.
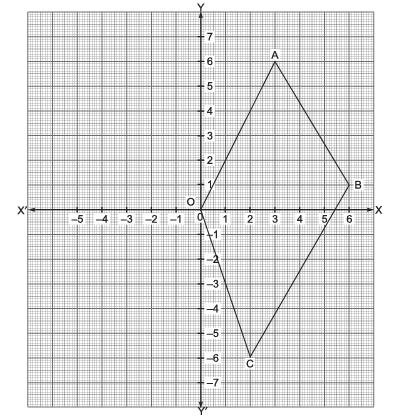
5. Write the co-ordinates of the following quadrilateral OABC.
6. In which quadrant or on which axis, do the points : (–3, 5), (2, –3), (–4, 0) and (0, 5) lie?
Verify your answer by locating them on the cartesian plane. 7. In which quadrant, the point (1, –2) lies?
1.Fill in the blanks: (i) The abscissa of the origin is ____. (ii) The ordinate of the point (–5, 3) is ____. (iii) The coordinates of origin are (____, ____). (iv) The ordinate of every point on x-axis is ____. (v) The abscissa of every point on y-axis is ____. (vi) The axes intersect at a point called ____.
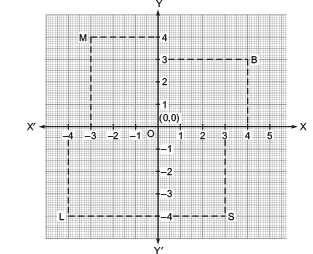
2. Look at the following figure and answer the questions given below. (i) What are the coordinates of B? (ii) What are the coordinates of M? (iii) What are the coordinates of L? (iv) What are the coordinates of S?
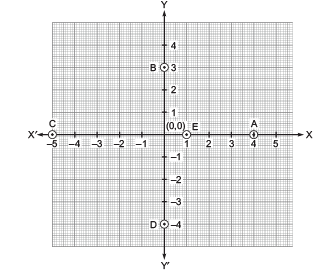
3. Write the coordinates of the points marked on the axes in the following figure.
4. Locate the following points in the Cartesian plane. (i) (4, 0) (ii) (0, 4) (iii) (–3, 0) (iv) (–3, 3) (v) (5, –3) (vi) (–3, 5) (vii) (–5, 3) (viii) (2, –7) (ix) (–7, –7)
Q1: If x/y + y/x = -1 and (xy, ≠ 0), the value of x3 – y3 is (a) 1 (b) -1 (c) 0 (d) 2 Ans: (c) x/y + y/x = -1 x2 + y2 = − xy or x2 + y2 + xy = 0 Now x3 – y3 = (x − y) (x2 + y2 + xy) = (x − y) × 0 = 0 Hence (c) is the correct answer
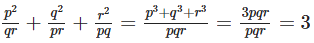
Q2: If p + q + r = 0 ,then the value of (a) 1 (b) 3 (c) -1 (d) 0 Ans: (b) Now we know that p3 + q3 + r3 − 3pqr = (p + q + r) (p2 + q2 + r2 − pq − qr − pr) as p + q + r = 0 p3 + q3 + r3 − 3pqr = 0 or p3 + q3 + r3 = 3pqr Now Hence (b) is the correct answer.
Q3: The product of (x + a) (x + b) is (a) x2 + (a + b)x + ab (b) x2 – (a – b)x + ab (c) x2 + (a – b)x + ab (d) x2 + (a – b)x + ab Ans: (a) (x+a) (x+b) = x(x+b) + a(x+b) =x2 + bx + ax + ab =x2 + (a+b)x + ab
Q5: The value of f(x) = 5x−4×2+3 when x = -1, is: (a) 3 (b) -12 (c) -6
(d) 6 Ans: (c)
To find the value of f(x) = 5x − 4x2+ 3 when x = −1, follow these steps:
Substitute x = −1 into the equation:
f (−1) = 5(−1) − 4(−1)2 + 3
f(−1) = −5 −4 + 3
f(−1) = −6
True or False
Q1: P(x) = x – 1 and g(x) =x2 – 2x + 1 . p(x) is a factor of g(x) Ans: True, as g(1) = 0
Q2: The factor of 3x2 – x – 4 are (x + 1)(3x – 4) Ans: True, we can get this by split method
Q3: Every linear polynomial has only one zero Ans: True
Q4: Every real number is the zero’s of zero polynomial Ans: True
Q5: A binomial may have degree 4 Ans: True, example x4 + 1
Q6: 0, 2 are the zeroes of x2– 2x Ans: True
Q7: The degree of zero polynomial is not defined Ans: True
Answer the following Questions
Q1: Is 3x1/2 – 4x + 15 a polynomial of one variable? Ans: No. it is not a polynomial
Q2: Is ∛x – √2x a polynomial Ans: No. It is not a polynomial
Q3: What will be the degree of polynomials 30x5 – 15x2 + 40 Ans: Degree of Polynomial is 5
Q4: Is (y2)1/2 + 2√3 a polynomial of one variable? Ans: Yes it is a polynomial of one variable
Q5: What will be the coefficient of x3 in 9x3 – 5x + 20. Ans: The coefficient of x3 is 9
Q6: Show that x = 1 is a root of the polynomial 3x3 – 4x2 + 8x – 7 Ans: On putting x = 1 X = 1 is root of polynomial 3x3 – 4x2 + 8x – 7 3(1)3 – 4(1)2 + 8(1) – 7 3 – 4 + 8 – 7 = 0 X = 1 is root of polynomial
Q.1. Which of the following is an irrational number?
(a)
(b) √3(c) 1/2
(d)
Ans.An irrational number is a number that cannot be expressed as a fraction of two integers and has an infinite non-repeating decimal representation.
Let’s evaluate the options:
(a) √49/64: This is a rational number because both the numerator and denominator are perfect squares, and their square root can be expressed as a fraction of integers. √49/64 = 7/8.
(b) √3: This is an irrational number because the square root of 3 cannot be expressed as a fraction of integers, and its decimal representation goes on infinitely without repeating.
(c) 1/2: This is a rational number because it can be expressed as a fraction of integers.
(d) -√1/4: This is a rational number because √1/4 = 1/2, and the negative sign only changes the sign of the rational number.
So, the irrational number among the given options is: (b) √3
Q.2. The numberin p/q form is
(a) 267/1000
(b) 26/10
(c) 241/900
(d) 241/999
Ans. (c)
Solution:let x be the p/q form, x =
multiply both side by 100,
100 x = …(i)
multiply both side by 10
1000 x = ….(ii)
Subtract (ii) – (i)
1000 x – 100 x =
900 x = 241
⇒ x = 241/900
Hence, option (c) is correct
Try yourself:
Q3: Every point on the number line represents, which of the following numbers?
A.Natural numbers
B.Irrational number
C.Rational number
D.Real numberExplanation
Ans. Every point on the number line represents
a: Real number as the number line represents all real numbers, which includes natural numbers, whole numbers, integers, rational numbers, and irrational numbers, but not imaginary numbers.
Q.4. The decimal representation of a rational number is either:
(a) Terminating or repeating
(b) Non-terminating and non-repeating
(c) Only terminating
(d) Only repeating
Ans: (a) Terminating or repeating
A rational number is any number that can be expressed as a fraction , where p and q are integers and
A terminating decimal is one that has a finite number of digits after the decimal point.
A repeating decimal is one where a block of digits repeats infinitely.
Q.5. Insert 3 irrational number between 2.6 and 3.8
Ans. 2.6 and 3.8
Irrational numbers are non repeating non – terminating
2.61010010001…..
2.802002000200002……
3.604004000400004…….
Q.6. What is the decimal form of the following no’s.
(a) 18/11
(b) 3/26
(c) 1/17
(d) 2/13
Ans.(a) 18/11 = 1.63636363…
(b) 3/26 = 0.11538461538
(c) 1/17 = 0.05882352941
(d) 2/13 = 0.15384615384
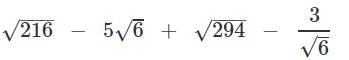
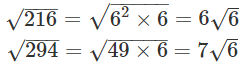
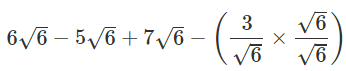
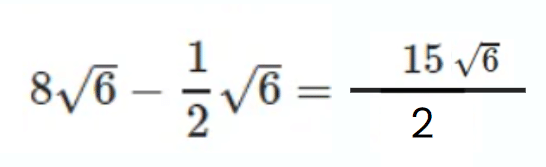
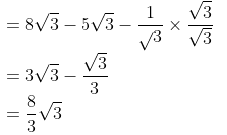
Q.8. Simplify:
Ans.
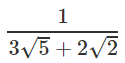
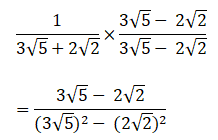
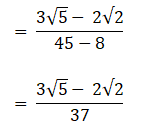
Q.9. Rationalise:
Ans.
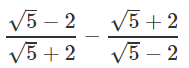
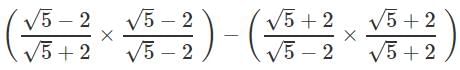
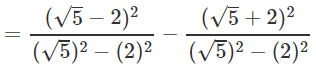
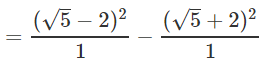
Q.10. Find the value of
Ans.= 5+4 – 4√5 – 5 – 4 – 4√5 = -8√5
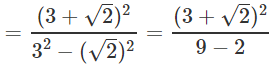
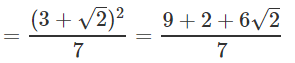
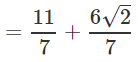
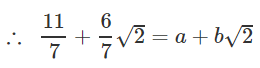
Q.11. If ,find the value of a & b.
Ans.Rationalising LHS∴ a = 11/7 and b = 6/7
Q.12. Evaluate:
Ans.
Q.13. Write the value of
Ans.= 15
Q.14. Express in p/q form.
Ans.let x be the p/q form,so, x = 10x = 1000x = 1000x – 10x = – 990x = 15555x= 15555/990= 1037/66
Q.15. Insert five rational no’s between 3/5 and 4/5.
Ans.3/5 and 4/530/50 and 40/50∴ pick any five number between 30 and 4031/50, 32/50, 36/50, 37/50, 39/50
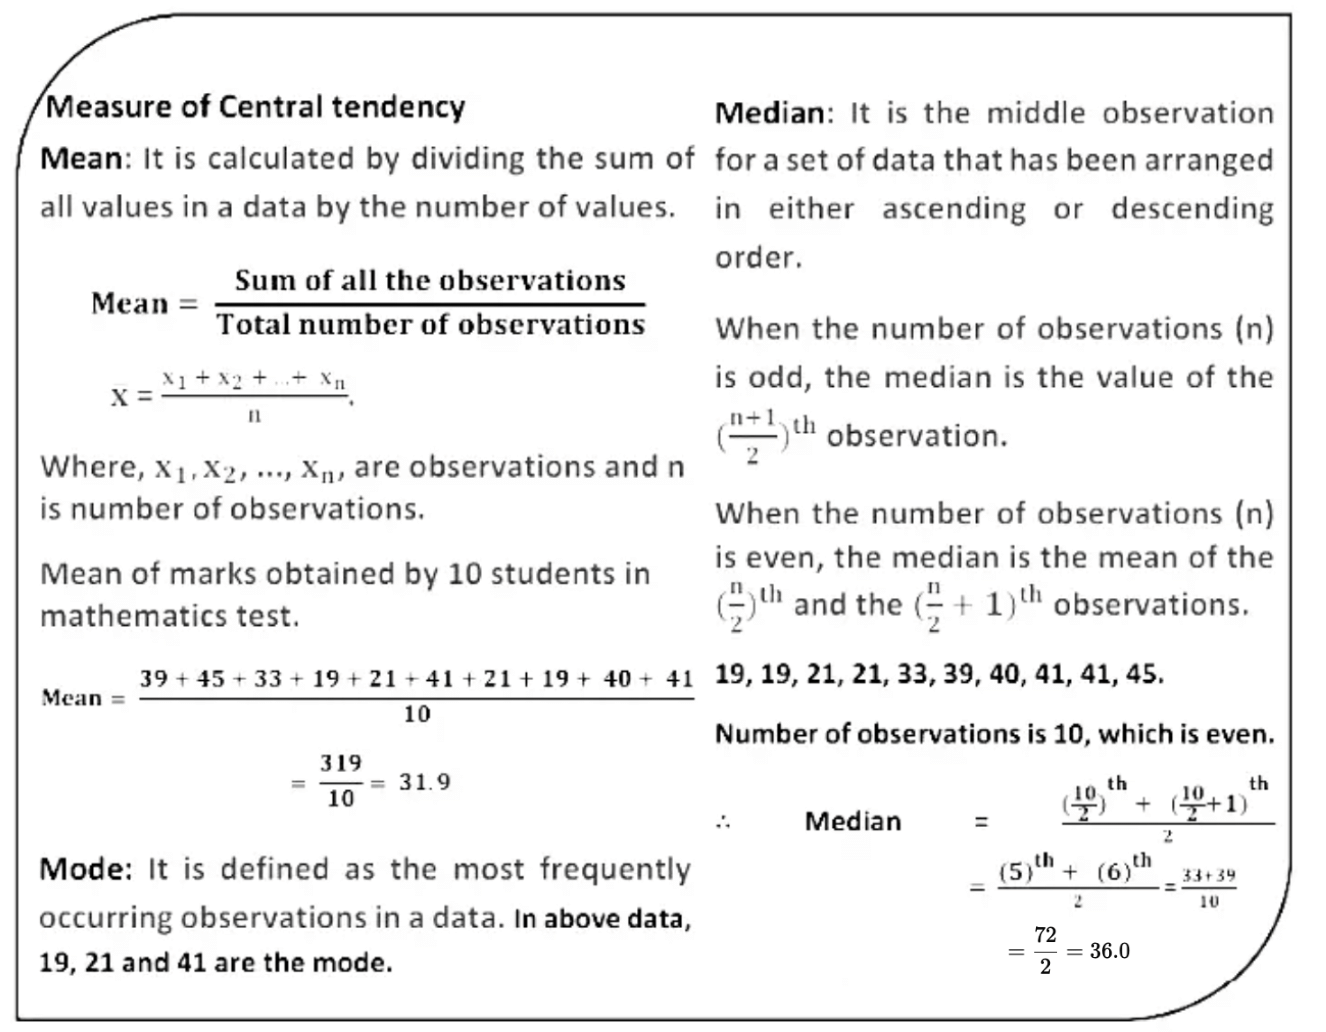
Every day we come across a lot of information in the form of facts, numerical figures, tables, graphs, etc. as shown below. For example:
Runs scored by a team,
Profits made by a company,
Temperatures recorded in a day of a city,
Expenditures in various sectors by the government,
The weather forecast, election results, and so on.
These facts or figures, which are numerical or otherwise, collected with a definite purpose are called data. Therefore, Data is a collection of facts, such as numbers, words, measurements, observations, etc.
Suppose, the following image shows the performance of the Indian Cricket team in tests in the last 2 years against major test playing nations.
Try yourself:
What is data?
A.A collection of facts and figures collected for a specific purpose.
B.Information presented in the form of numerical figures, tables, and graphs.
C.Observations and measurements recorded for analysis.
D.All of the above.
Types of data based on the collection of facts Qualitative data: It is descriptive data. For examples:
Rajan is thin.
Suman can run fast.
The cake is orange in colour.
She has black hair.
He is tall.
Quantitative data: It is numerical information. For examples:
I updated my phone 6 times in a quarter
83 people downloaded the latest mobile application
She has 10 holidays in this year
500 people attended the seminar
54% of people prefer shopping online instead of going to the mall.
Graphical Representation of Data
A graphical representation is the visual display of data and its statistical results. It is more often and effective than presenting data in tabular form. Bar graphs, Histograms, and frequency polygons are different types of graphical representation, which depend on the nature of the data and the nature of statical results.
We shall study the following graphical representations in this section:-
(A) Bar graphs
(B) Histograms of uniform width, and of varying widths
(C) Frequency polygons
Also read: NCERT Solutions: Statistics (Exercise 12.1)
(A) Bar graphs
Bar graphs are the bars of uniform width that can be drawn horizontally or vertically with equal spacing between them and then the length of each bar represents the given number. Such a method of representing data is called a bar diagram or a bar graph.
We generally use bar graphs to clearly represent categorical data or any ungrouped discrete frequency observations.
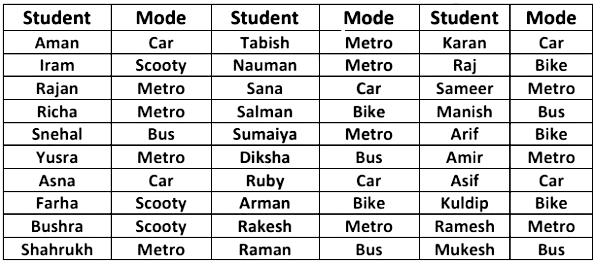
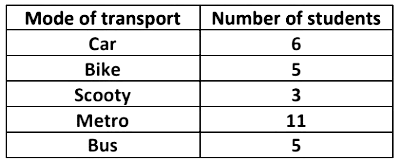
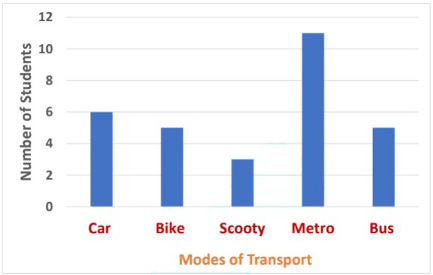
Example 1: Considering the modes of transport of 30 students of class 9th is given below:
In order to draw the bar graph for the data above, we prepare the frequency table as given below.
Now, we can represent this data using a bar graph, by following the steps as shown below:
First, we draw two axes viz. x–axis and y–axis. Then, we decide what each axis of the graph represents. By convention, the variates being measured goes on the horizontal (x–axis) and the frequency goes on the vertical (y–axis).
Next, decide on a numeric scale for the frequency axis. This axis represents the frequency in each category by its height. It must start at zero and include the largest frequency.
Having decided on a range for the frequency axis we need to decide on a suitable number scale to label this axis. This should have sensible values, for example, 0, 1, 2, . . . , or 0, 10, 20 . . . , or other such values as to make sense given the data.
Draw the axes and label them appropriately.
Draw a bar for each category. When drawing the bars it is essential to ensure the following:
the width of each bar is the same
the bars are separated from each other by equally sized gaps
Range = Maximum Value – Minimum Value
Class size = Range/Number of classes
Using this bar graph, we can easily identify the most popular mode of transport is the metro. Bar graphs provide a simple method of quickly spotting patterns within a discrete data set.
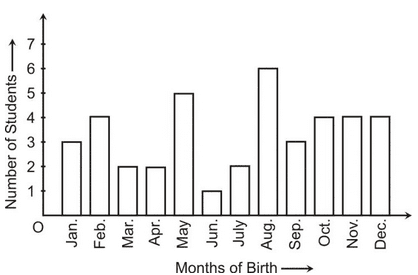
Example 2: In a particular section of Class IX, 40 students were asked about the months of their birth and the following graph was prepared for the data so obtained:
Observe the bar graph given above and answer the following questions :
(i) How many students were born in the month of November ?
(ii) In which month were the maximum number of students born ?
Solution: (i) 4 students were born in the month of November.
(ii) The Maximum number of students were born in the month of August.
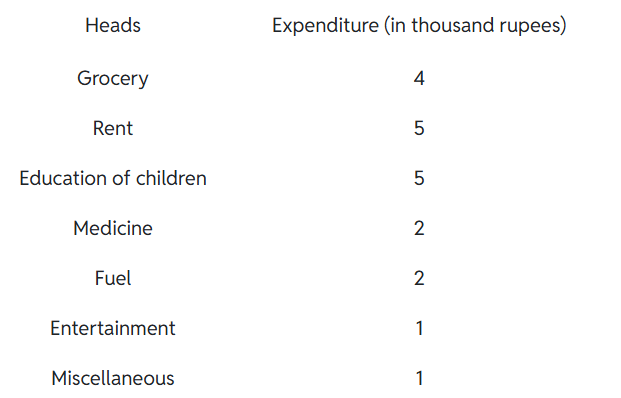
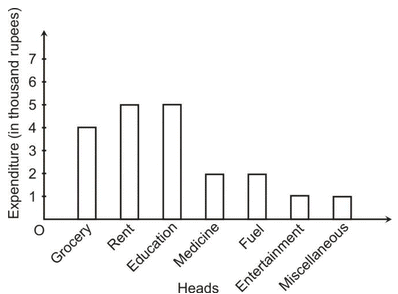
Example 3: A family with a monthly income of Rs 20,000 had planned the following expenditures per month under various heads:
Draw a bar graph for the data above.
Solution:
(B) Histogram
Histogram was first introduced by Karl Pearson in 1891. Bar charts have their limitations; like they cannot be used to represent continuous data. When dealing with continuous random variables different kinds of graphs are used. This type of graph is called a histogram. At first sight, a histogram looks similar to bar charts. However, there are two critical differences:
The horizontal (x-axis) is a continuous scale. As a result of this, there are no gaps between the bars (unless there are no observations within a class interval).
The height of the rectangle is only proportional to the frequency of the class if the class intervals are all equal. With histograms, it is the area of the rectangle that is proportional to its frequency.
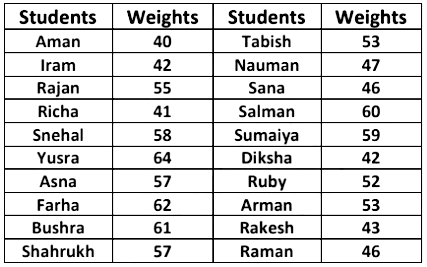
Example 4: Consider the weights of 20 students of a class 9th as given below:
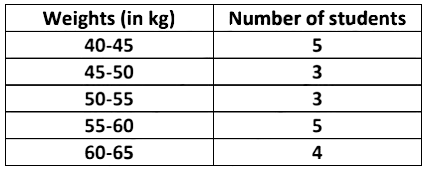
Now, arranging the data in ascending order. 40, 41, 42, 42, 43, 46, 46, 47, 52, 53, 53, 55, 57, 57, 58, 59, 60, 61, 62, 64. In order to draw the histogram for the data above, we prepare the frequency table as given below.
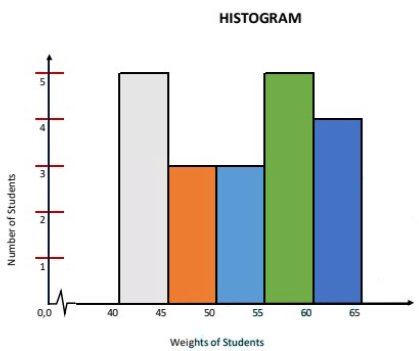
We can represent this information using histogram, by following steps as shown below:
Find the maximum frequency and draw the vertical (y–axis) from zero to this value.
The range of the horizontal (x–axis) needs to include a full range of the class intervals from the frequency table.
Draw a bar for each group in your frequency table. These should be the same width and touch each other (unless there are no data in one particular class).
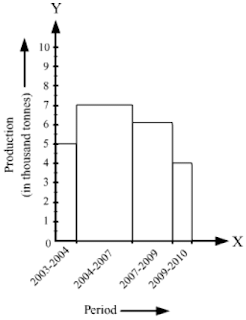
Example 5: The following histogram shows the production of food grains over a period of time.
What is the total production of food grains from 2004 to 2009? In which periods were the production of food grains the highest and the lowest? Solution: The total production of food grains from 2004 to 2009 can be ascertained by adding the heights of the class intervals 2004–2007 and 2007–2009. ∴ Total production of food grains from 2004 to 2009 = 7000 tonnes + 6000 tonnes = 13000 tonnes It is clear from the histogram that the bar corresponding to the class interval 2004–2007 is the tallest, and that corresponding to the class interval 2009–2010 is the shortest. So, the production of food grains was the highest in the period 2004–2007 and the lowest in the period 2009–2010.
Try yourself:
Which type of data is descriptive in nature?
A.Qualitative data
B.Quantitative data
C.Both A and B
D.None of the above
(C) Frequency Polygon
It is a natural extension of the histogram. In frequency polygon rather than drawing bars, each class is represented by one point and these are joined together by straight lines. We draw frequency polygons in a similar way to drawing a histogram.
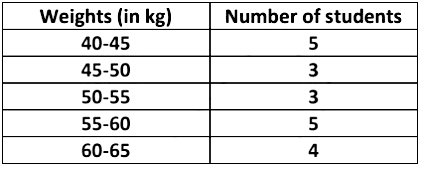
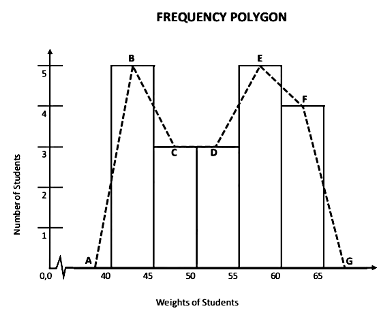
Example 6: Consider the weights of 20 students of a class 9th as given below:
Now, arranging the data in ascending order. 40, 41, 42, 42, 43, 46, 46, 47, 52, 53, 53, 55, 57, 57, 58, 59, 60, 61, 62, 64. In order to draw the frequency polygon for the data above, we prepare the frequency table as given below.
We can then present this information as a frequency polygon, by following the process of the steps shown below:
Prepare a frequency table.
Find the maximum frequency and draw the vertical (y–axis) from zero to this value.
The range of the horizontal (x–axis) needs to include all class intervals from the frequency table.
Draw bars for each class interval in the frequency table. These bars should be of the same width and are adjacent to each other (unless there are no data in one particular class)
Connect the midpoints of the top side of each bar by a dotted line as shown below.
Frequency polygons can also be drawn independently without drawing histograms. For this, we require the mid-points of the class-interval. These mid-points of the class intervals are called class marks. Class-mark = (Upper Limit + Lower Limit ) / 2
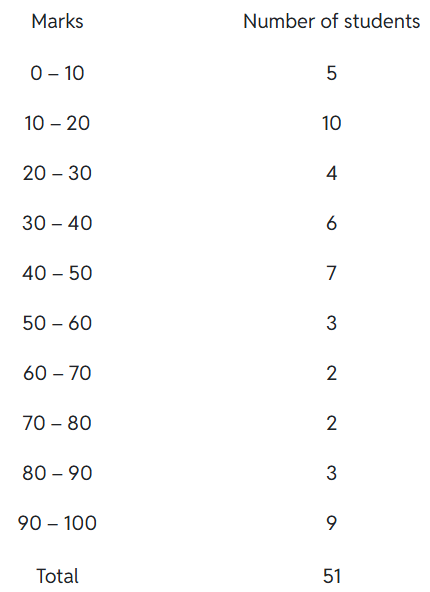
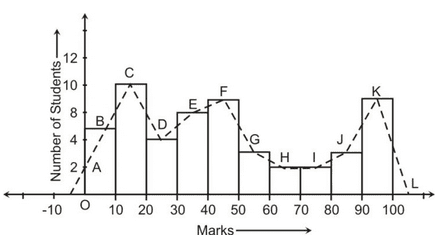
Example 7:Consider the marks, out of 100, obtained by 51 students of a class in a test, given in Table.
Draw a frequency polygon corresponding to this frequency distribution table.
Solution:
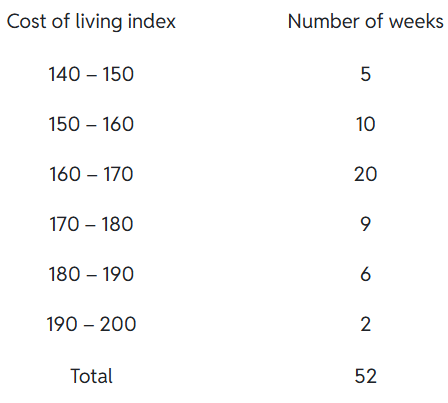
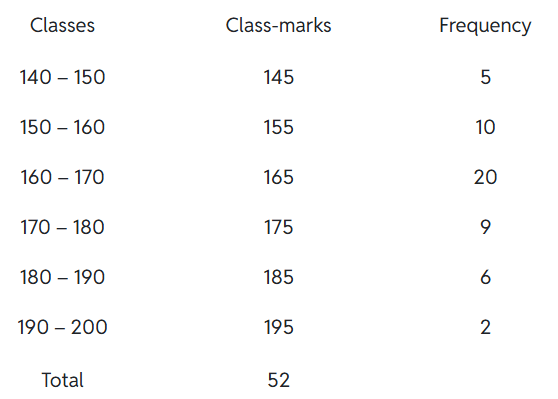
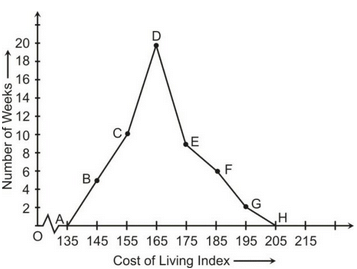
Example 8: In a city, the weekly observations made in a study on the cost of living index are given in the following table:
Surface area is like the total paper to cover a 3D object.
Volume is the space it occupies.
Ever wondered how we measure the wrapping needed for a gift or the space inside a box?
Wrapping Paper
It’s how we quantify the outside and inside of shapes. So, how do we calculate these for different objects?
Let’s explore the answers by unravelling the mystery of surface area and delving into the roominess of volume!
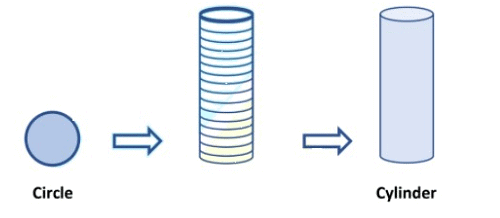
Suppose, we cut out a circle shape from a cardboard sheet.
Then we cut many such circles identical to the first one and then pile them up in a single column. [Shown in the figure].
Then the shape we obtained will be a 3-dimensional shape.
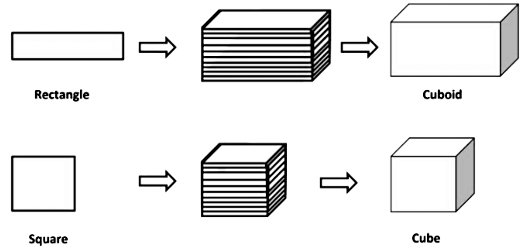
By this process, we shall obtain some solid figures such as a cuboid and cube as shown below.
All solid objects occupy some space and have three dimensions – length, breadth, and height or depth.
Three-dimensional (3-d)shapes have four parts that set them apart from 2-d shapes viz. faces, vertices, edges, and volume.
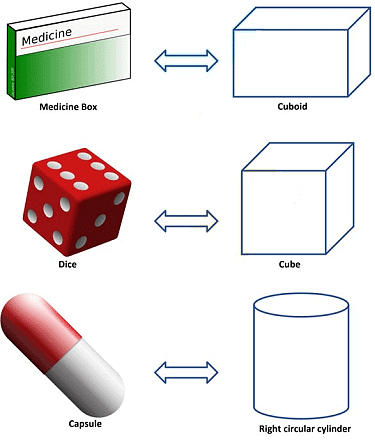
Some real-life examples which resemble solid shapes as shown below.
Try yourself:
What is the difference between surface area and volume?
A.Surface area is the total paper to cover a 3D object, while volume is the space it occupies.
B.Surface area is the space inside a 3D object, while volume is the total paper to cover it.
C.Surface area is the total space occupied by a 3D object, while volume is the space it occupies.
D.Surface area is the space outside a 3D object, while volume is the total space occupied by it.
Surface Area of Right Circular Cones
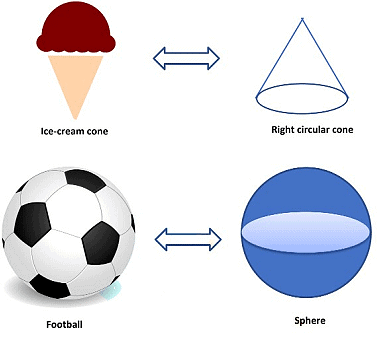
In this chapter, when we refer to a ‘cone’, we mean a ‘right circular cone’. These cones are three-dimensional shapes with a circular base that narrows down to a single point known as the apex or vertex. A familiar example is an ice cream cone.
The curved surface of a right circular cone is called the lateral surface, and the distance from the apex to the base is known as the height. It is important to grasp the properties of right circular cones to calculate their surface area and volume, which rely on their specific geometric features.
Activity: Construction of a Cone
To grasp how a right circular cone is formed, follow these steps:
Cut out a right-angled triangle ABC, with the right angle at B.
Attach a thick string along one of the perpendicular sides, for example, AB.
Rotate the triangle around the string. Notice the shape that forms — a cone.
This shape is known as a right circular cone. Here, point A is the vertex, AB is the height, BC is the radius, and AC is the slant height of the cone.
Curved Surface Area of a Cone
Definition and Formula
The curved surface area (CSA) of a cone can be found using this formula:
Curved Surface Area (CSA) = πrl
In this formula, r is the radius of the base, l is the slant height, and π can be approximated as 3.14 or 22/7.
Additional Information
From the cone’s cross-section, the relationship l² = r² + h² can be derived, where h is the height of the cone.
If the cone’s base is closed, a circular piece of paper with an area of πr² is needed, which adds to the total surface area.
Total Surface Area of a Cone = πrl + πr² = πr(l + r)
Example: Find the curved surface area of a right circular cone with a slant height of 10 cm and base radius of 7 cm. Solution: Curved surface area = πrl = 22/7 × 7 × 10 = 220 cm²
Total Surface Area of a Cone
Definition
The total surface area of a cone is the total of its curved surface area (CSA) and the area of its base. The formulas are as follows:
Curved Surface Area (CSA)
CSA = πrl
where r is the radius of the base and l is the slant height of the cone.
Area of the Base
Area of base = πr²
Total Surface Area
Total Surface Area = CSA + Area of base = πrl + πr² = πr(l + r)
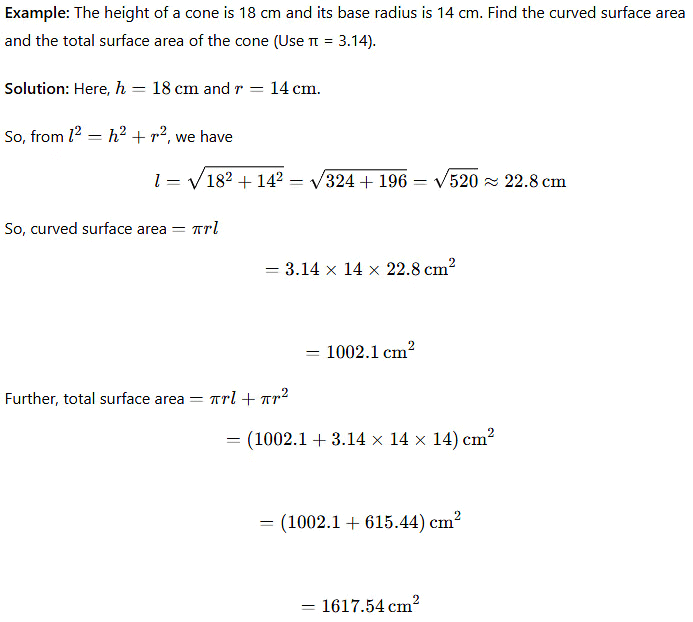
Example: The height of a cone is 16 cm and its base radius is 12 cm. Find the curved surface area and the total surface area of the cone (Use π = 3.14). Solution:
Also read: Short & Long Question Answer: Surface Areas and Volume
Surface Area of Sphere
Spheres are completely round three-dimensional shapes, similar to balls or globes.
Every point on a sphere’s surface is the same distance from its centre.
Examples include:
A basketball
The nearly spherical shape of the Earth
Spheres do not have edges or corners.
Surface Area Calculation
The surface area of a sphere is calculated as:
Surface Area=4��Surface Area=4πr2
Here, �r is the sphere’s radius.
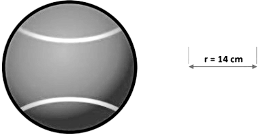
Example: Find the surface area of a tennis ball of radius 14 cm.
Clearly, the tennis ball is in the form of a sphere. Here, the radius of the sphere is 14 cm. We know that, Surface Area of the sphere =4πr2. Therefore, the Surface Area of a tennis ball =4πr2. = 4 × 22/7 × (14 cm)2. = 4 × 22/7 × 14cm × 14 cm. = 4 × 22 × 2cm × 14 cm. = 2464 cm2. Hence, the Surface area of the tennis ball is 2464 cm2.
Note: A sphere doesn’t have separate curved and total surface areas because its entire surface is curved. In other words, there are no flat or planar sections on a sphere. The term “surface area” for a sphere typically refers to the total surface area, which includes both the curved surface area and the area of the sphere’s base (which is also curved).
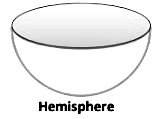
Surface Area of Hemisphere
A hemisphere, which is half of a sphere, has a surface area calculated as 3πr².
Surface Area of Hemisphere= 3/2×4πr2=3πr2
Imagine a sphere cut directly in half with a plane through its centre.
This creates two equal parts, known as a hemisphere (since ‘hemi’ means ‘half’). A hemisphere consists of a curved face and a flat base.
The curved surface area of a hemisphere is half of the sphere’s surface area, which is 1/2 of 4πr².
Curved Surface Area of a Hemisphere = 2πr²
Here, r represents the radius of the sphere from which the hemisphere is derived. The total surface area of the hemisphere, combining both faces, is calculated as 2πr² + πr². Thus, the Total Surface Area of a Hemisphere = 3πr².
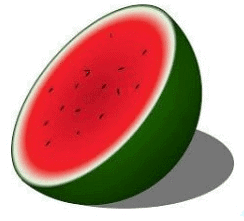
Example: Calculate the curved surface area and total surface area of a hemisphere with a radius of 7 cm.
Solution: Consider a half slice of watermelon, shaped like a hemisphere with a radius of 7 cm. The curved surface area is calculated as follows:
Thus, the Curved Surface area of the watermelon slice is 308 cm².
Furthermore, the total surface area of a hemisphere is computed as:
Total Surface Area of Hemisphere = 3πr² = 3 × (22/7) × (7 cm)² = 3 × (22/7) × 49 cm² = 462 cm².
Therefore, the total surface area of the half slice of watermelon is 462 cm².
What is Volume?
Volume refers to the amount of space occupied by a three-dimensional object. It is a measure of how much “stuff” or substance an object can hold. The concept of volume is often applied to various geometric shapes, such as cubes, spheres, cylinders, and cones.
Volume of a Cone
The volume (�V) of a cone is calculated using the formula:
�=13��2ℎV= 1/3πr2h
Here, �r is the base radius, and ℎh is the height of the cone.
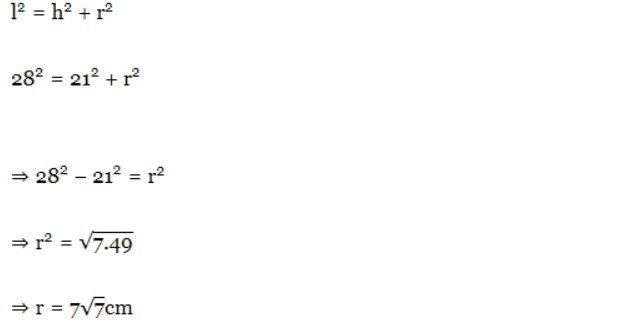
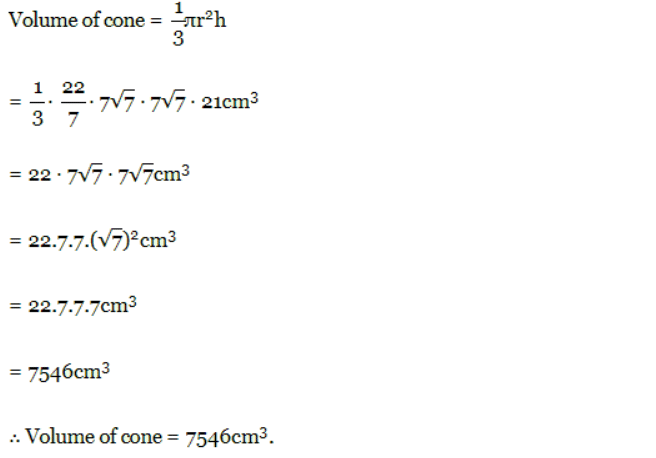
Example:
Given the height (ℎh) and slant height (�l) of a cone as 21 cm and 28 cm respectively, find the volume.
Solution: Slant height (l) = 28cm; Height of cone (h) = 21cm ; Let radius of cone = r cm we know that,
Volume of a Sphere
The volume (V) of a sphere can be understood by thinking about how much water the sphere pushes aside when it is put in water. This basic idea is very important. The volume of a sphere can be calculated using the formula:
V = 4/3 × π × r3
In this formula, r stands for the radius of the sphere.
Example: Find the volume of a sphere with a radius of 11.2 cm. Solution: To calculate the volume of a sphere with a radius of 11.2 cm, we can use the formula:
Try yourself:What is the formula for calculating the curved surface area of a cone?
A.CSA = πr^2
B.CSA = πrl
C.CSA = 2πr
D.CSA = 2πrl
Volume of a Hemisphere
The volume of a hemisphere is half of a sphere.
You can calculate the volume of a hemisphere using the formula:
Volume of a Hemisphere = (2/3)πr³
In this formula:
r is the radius of the hemisphere, and
π is a mathematical constant, roughly equal to 3.14159.
The volume of a sphere is given by Volume of a Sphere = (4/3)πr³, where r is the radius of the sphere.
Since a hemisphere is half of a sphere, its volume is half the volume of a sphere.
Example: A dome of a building is shaped like a hemisphere. The cost to whitewash it from the inside was Rs. 4989.60. If the cost to whitewash is Rs. 20 per square metre, calculate: (i) The inside surface area of the dome (ii) The volume of the air inside the dome Solution: (i) The cost of whitewashing the dome from the inside is Rs. 4989.60.
The cost to whitewash 1m² is Rs. 20.
The curved surface area of the inner side of the dome is:
Curved Surface Area = Total Cost / Cost per m² = 4989.60 / 20 = 249.48 m²
(ii) Let the inner radius of the dome be r.
The curved surface area of the inner side of the dome is 249.48 m² (from (i)).
The formula for the curved surface area (CSA) of a hemisphere is:
CSA = 2πr²
So, we have:
2πr = 249.48
2 × (22/7) × r² = 249.48
r² = (249.48 × 7) / (2 × 22)
r² = 39.69
r = 6.3
Thus, the radius is 6.3 m.
The volume of air inside the given dome = Volume of hemispherical dome
Using the formula, the volume of the hemisphere is:
Volume = (2/3)πr³
= (2/3) × (22/7) × 6.3 × 6.3 × 6.3
= 523.9 (approx.)
The volume of air inside the dome is approximately 523.9 m³.
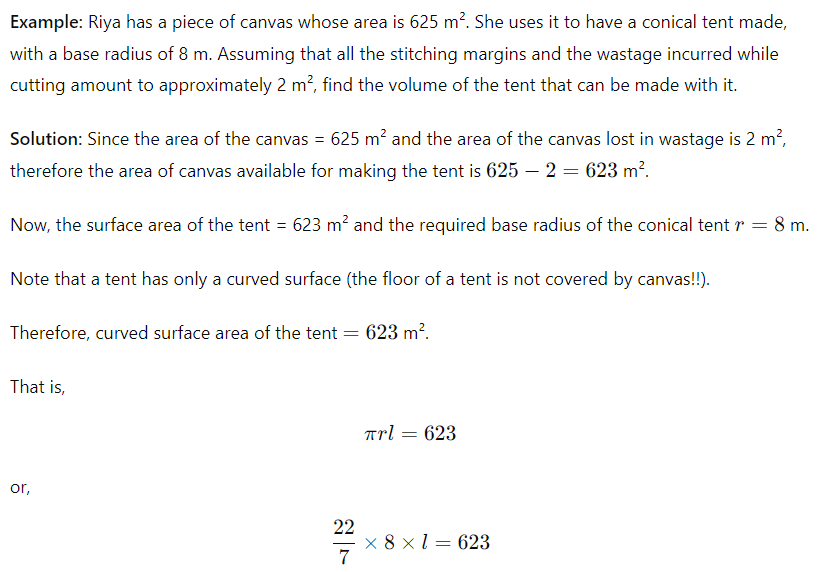
Today, we’re diving into the fascinating world of geometry with Heron’s Formula. Have you ever wanted to calculate the area of a triangle without knowing its height?
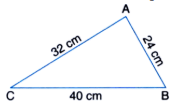
For instance, consider a triangular park with sides measuring 40 m, 32 m, and 24 m. If we were to use the conventional formula for area, ½ x base x height.
We would need to know the height, which we don’t have. This is where Heron’s Formula comes in, allowing us to find the area of a triangle using just the lengths of its three sides.
In this lesson, we will explore how to use Heron’s Formula step-by-step and apply it through engaging examples. So, get ready to unlock the secrets of triangles and discover the beauty of geometry!
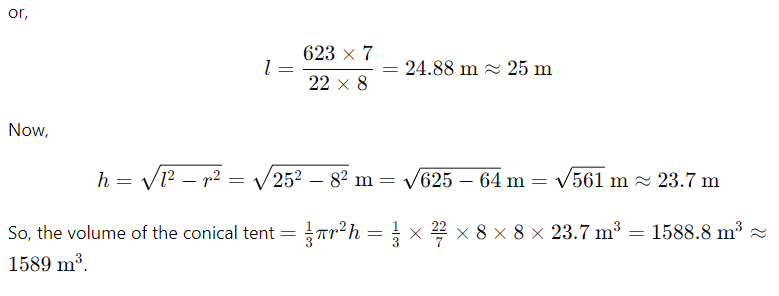
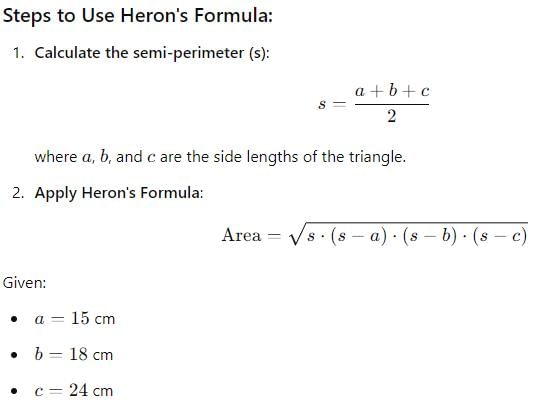
Area of a Triangle — by Heron’s Formula
Heron, a mathematician born around 10 AD, made significant contributions to applied mathematics. His works covered various mathematical and physical subjects.
In his geometrical works, Heron derived the famous formula for the area of a triangle based on its three sides. This formula is now known as Heron’s formula or Hero’s formula
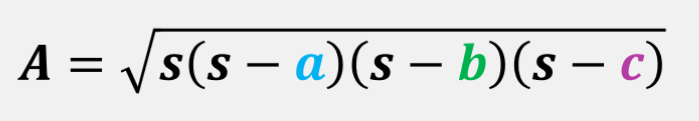
Area=�(�−�)(�−�)(�−�)
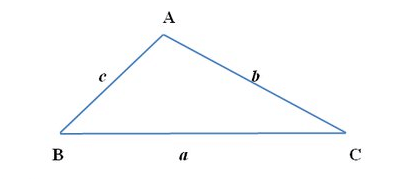
Here, �a, �b, and �care the sides of the triangle, and �s is the semi-perimeter i.e sum of all-side divided by 2
s= (a+b+c) /2
�=�+�Application of Heron’s Formula
Let’s apply Heron’s formula to find the area of a triangular park with sides 40 cm, 32 cm, and 24 cm:
�=40+32+242=48
Let us take a = 40 cm, b = 24 cm, c = 32 cm,
Semi perimeter of the triangle (s) = (a + b + c)/2
s = (40 + 32 + 24)/2 = 48 cm
�−�=48−40=8s −a = 48 − 40 = 8 cm�−�=48−24=24
s −b = 48 − 24 = 24 cm �−�=48−32=16
s −c = 48 − 32 = 16 cm
Area of the triangle = √[s(s-a)(s-b)(s-c)]
Area=48×8×24×16=3842=384 m2
This matches the area calculated using the traditional method:
To ascertain the park’s area, the application of the formula 12×32×24½ × 32 × 24 square meters yields 384 cm².
Try yourself:What is the formula for calculating the area of a triangle using Heron’s formula?
A.Area = (a + b + c)/2
B.Area = √(s(s-a)(s-b)(s-c))
C.Area = 1/2 * base * height
D.Area = (1/2) * a * b * sin(C)
Verification and Examples
Now, let’s verify Heron’s formula by applying it to other triangles:
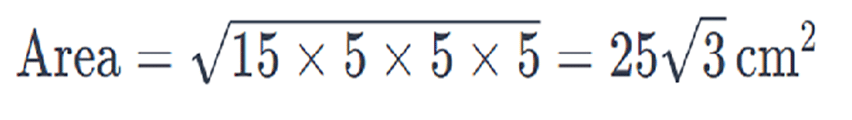
Equilateral triangle (side =10 cm )
s= (a+b+c) /2
=> (10+10+10) /2
=> 30/2 =15
=> s= 15
replacing all values in the above area formulae we get ,
Additional Examples:
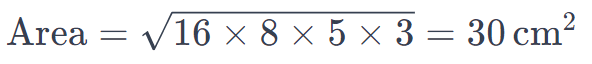
Example 1:
Given sides of triangle 8 cm, and 11 cm, and a perimeter of 32 cm, the area is calculated using Heron’s formula:
Area=16×8×5×3=30 cm2
Example 2:
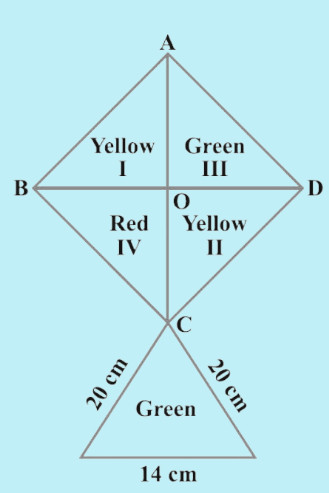
How much paper of each shade is needed to make a kite given in the figure, in which ABCD is a square with diagonal 44 cm.
Solution:
According to the figure,
AC = BD = 44cm, AO = 44/2 = 22cm, BO = 44/2 = 22cm
From ΔAOB,
AB2 = AO2 + BO2
⇒ AB2 = 222 + 222
⇒ AB2 = 2 × 222
⇒ AB = 22√2 cm
Area of square ABCD = (Side)2
= (22√2)2
= 968 cm2
Area of each triangle (I, II, III, IV) = Area of square /4
= 968 /4
= 242 cm2
To find area of lower triangle,
Let a = 20, b = 20, c = 14
s = (a + b + c)/2
⇒ s = (20 + 20 + 14)/2 = 54/2 = 27.
Area of the triangle = √[s(s-a)(s-b)(s-c)]
= √[27(27-20)(27-20)(27-14)]
= √[27×7×7×13]
= 131.14 cm2
Therefore, We get,
Area of Red = Area of IV
= 242 cm2
Area of Yellow = Area of I + Area of II
= 242 + 242
= 484 cm2
Area of Green = Area of III + Area of the lower triangle
= 242 + 131.14
= 373.14 cm2Area=125×5×45×75=15×30 m2=450 m2
Example 3:
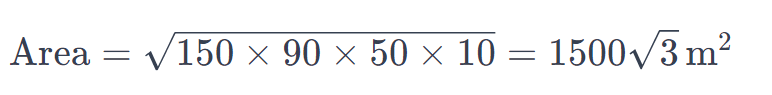
A triangular plot has sides in the ratio 3:5:7, and its perimeter is 300 m. The area is:
Area=150×90×50×10=15003 m2
These examples illustrate Heron’s formula as a powerful tool for finding triangle areas without relying on height.
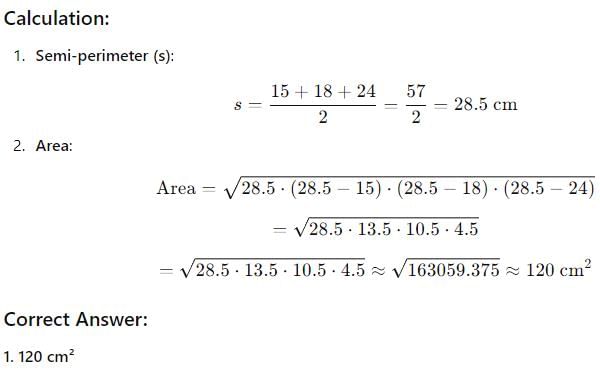
Try yourself:What is the area of a triangle with sides measuring 15 cm, 18 cm, and 24 cm?
A circle is a unique figure; it is everywhere around us. We see the dials of clocks, buttons of shirts, coins, wheels of a vehicle, etc. All these are in the shape of a circle.
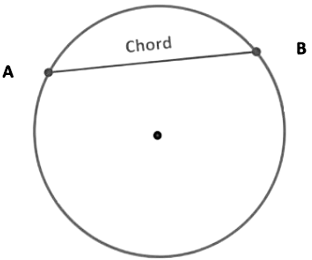
Terms related to circles 1. Chord: The chord of a circle is a straight line segment whose endpoints lie on the circle.
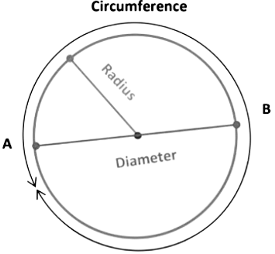
2. Diameter: The chord, which passes through the center of the circle is called a diameter of the circle. Diameter is the longest chord and all diameters have the same length, which is equal to two times the radius of the circle.
The length of the complete circle is called its circumference.
Try yourself:What is the theorem that states the sum of either pair of opposite angles of a cyclic quadrilateral?
A.The perpendicular from the center of a circle to its chord
B.Chords equidistant from the center of a circle are equal in length
C.The angle subtended by an arc of a circle at the center is double the angle subtended by it at any point on the circle
D.The sum of either pair of opposite angles of a cyclic quadrilateral is 180°
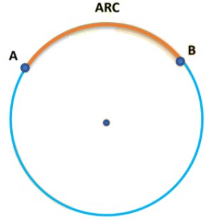
3. Arc: The arc of a circle is a portion of the circumference of a circle.Or
A piece of a circle between two points is also called an arc.
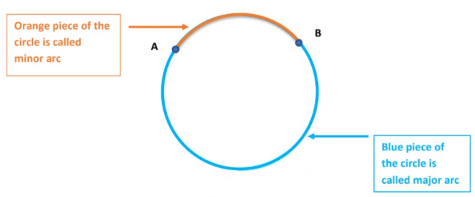
Two points lying on the circle define two arcs: The shorter one is called a minor arc and the longer one is called a major arc.
The minor arc AB is also denoted by and the major arc AB by where D is some point on the arc between A and B. When A and B are ends of a diameter, then both arcs are equal and each is called a semicircle.
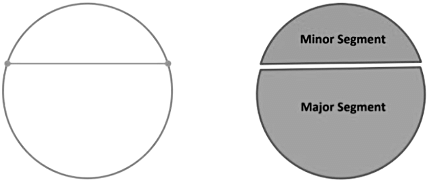
4. Segment: The region between a chord and either of its arc is called a segment of the circle. There are two types of segments also: which are the major segment and the minor segment.
Angle Subtended by a Chord at a Point
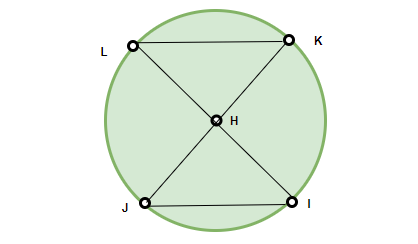
Theorem 1: Equal chords of circle subtend equal angles at the centre.
Given:
A circle with centre H.
Two chords KL and JI are equal
To Prove: ∠KHL = ∠JHI Proof: We are given two chords KL and JI. We need to prove that ∠KHL = ∠JHI. In triangles KHL and JHI, HK = HJ —- radii of the same circle HL = HI—- radii of the same circle KL = JI – given So, ∆ KHL≅ ∆ JHI,
Thus, ∠KHL = ∠JHI —- by CPCT. Hence, proved.
Theorem 2: If the angles subtended by two chords at the centre are equal, then the two chords are equal
Given:
A circle with centre O.
∠COD = ∠AOB are equal
To Prove: AB=CD
Proof:
We are given two chords AB and CD. We need to prove that two chords AB and CD are equal
OA = OB = OC= OD (Radii of the same circle) ……………(2)
From eq. 1 and 2, we get;
∆AOB ≅ ∆COD (SAS Axiom of congruency)
Since,
OA = OB = OC= OD
AB = CD ……… (By CPCT)
Also read: PPT: Circles
Perpendicular from the Centre to a Chord
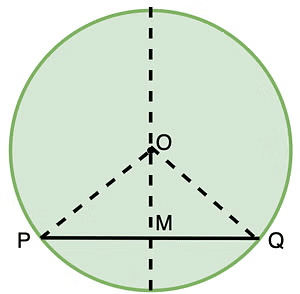
Theorem 3: The perpendicular from the centre of a circle to a chord bisects the chord
Given: A circle with centre O.
PQ is a chord such that OM is perpendicular to PQ
To Prove: OM bisects chord PQ i.e. PM=MQ
Constructions: Join O to Q and O to P. Proof: Given, in ∆QMO and ∆PMO, ∠OMP = ∠OMQ = 90° (OM ⊥ PQ) ………(1) OP = OQ (Radii of the circle) ……….(2) OM = OM (Common side) ………….(3) From eq. (1), (2) and (3), we get; ∆QMO ≅ ∆PMO (R.H.S Axiom of congruency) Hence, PM=MQ (By CPCT)
Theorem 4: The line drawn through the centre of a circle to bisect a chord is perpendicular to the chord
Given:
A circle with centre O.
OM bisects chord PQ i.e. PM=MQ
To Prove: PQ is a chord such that OM is perpendicular to PQ i.e ∠OMQ = 90°.
Constructions: Draw PQ be the chord of a circle and OM be the line from the centre that bisects the chord such that M is the mid point of the chord
Also, Join O to Q and O to P. Proof: In triangles ΔPMO and ΔQMO
PM = MQ (given, OM bisects PQ) OP = OQ (radius of the same circle) OM = OM (common side of both the triangles) So, ∆PMO≅ ∆QMO Therefore, ∠OMQ = ∠OMP —(CPCT)—–(i) but ∠OMQ +∠OMP = 180 ° — linear pair Substituting equation (i) in above equation ∠OMQ + ∠OMQ = 180 ° Therefore,
∠OMQ = 90 °
This gives, angles ∠OMQ and ∠OMP as 90° Hence proved
Equal Chords and Distance from the Centre
If two chords of a circle are equal, then their corresponding arcs are congruent and conversely, if two arcs are congruent, then their corresponding chords are equal. Similar to the case of chords, equal arcs also subtend equal angles at the centre.
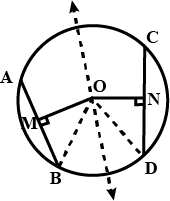
Theorem 5: Equal chords of a circle are equidistant (equal distance) from the centre of the circle.
Given:
A circle with centre O.
AB and CD are two equal chords of a circle i.e. AB=CD and OM and ON are perpendiculars to AB and CD respectively.
Constructions: Join O to B and O to D Draw perpendicular bisector of both chords from center O (OM ⊥ AB and ON ⊥ CD) . To Prove: OM=ON
Proof:
Since AB = CD
BM = 1/2 AB (Perpendicular to a chord bisects it) ……..(1)
DN = 1/2 CD (Perpendicular to a chord bisects it) ……..(2) Therefore, BM = DN
In ∆OMB and ∆OND
BM = DN (proved as above)
OB = OD (Radii of the same circle)
∠OMB = ∠OND = 90° (OM ⊥ AB and ON ⊥ CD)
∆OMB ≅ ∆OND ( By R.H.S Axiom of Congruency)
OM = ON ( By CPCT) Hence proved
Theorem 6: Chords of a circle, which are at equal distances from the centre are equal in length
Given:
A circle with centre O.
AB and CD are at equal distance from the circle, OM and ON are perpendiculars to AB and CD respectively.
OM=ON
To Prove: AB=CD
Proof: In ∆OMB and ∆OND, OM = ON ………….(1)
∠OMB = ∠OND = 90° ………..(2)
OB = OD (Radii of the same circle) ………..(3)
Therefore, from eq. 1, 2 and 3, we get;
∆OMB ≅ ∆OND (By R.H.S Axiom of Congruency)
BM = DN ( By CPCT)
1/2 AB = 1/2 CD (Perpendicular from center bisects the chord)
Therefore, AB = CD Hence Proved
Theorem 7: The angle subtended by an arc at the centre is double the angle subtended by it at any point on the remaining part of the circle.
Given: An arc PQ of a circle subtending angles POQ at the centre O and PAQ at a point A on the remaining part of the circle.
To Prove :∠POQ = 2∠PAQ.
Proof:
Let’s consider three cases,
Arc PQ is major arc.
Arc PQ is minor arc.
Arc PQ is semi-circle.
Let’s join AO and extend it to B. In all three cases, ∠BOQ = ∠OAQ + ∠OQA. (Exterior angle of a triangle is equal to the sum of the two interior opposite angles). Also in triangle ΔOAQ, OA = OQ (Radii of Circle) Therefore, ∠ OAQ = ∠ OQA this gives, ∠ BOQ = 2∠OAQ —(i) ∠ BOP = 2∠OAP—-(ii) from (i) and (ii) we get, ∠ BOP + ∠ BOQ = 2(∠ OAP + ∠ OAQ) ∠POQ = 2 ∠PAQ Hence Proved For the case (iii), where PQ is the major arc, (3) is replaced by Reflex angle POQ = 2∠PAQ
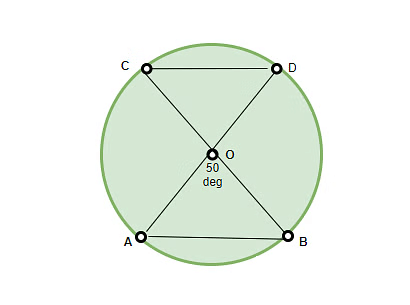
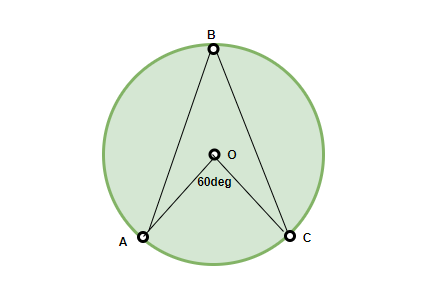
Example 2: What is the value of ∠ABC?
Solution: According to the above theorem (The angle subtended by an arc at the centre is double the angle subtended by it at any point on the remaining part of the circle), ∠AOC = 2 ∠ABC Therefore, ∠ABC = 60°/2 = 30° line segment joining two points subtends equal angles at two other points lying on the same side of the line containing the line segment, the four points lie on a circle (i.e., they are concyclic).
Some other properties
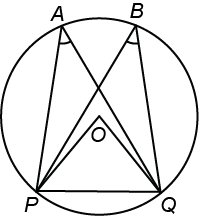
Angles in the same segment of a circle are equal.
If a line segment joining two points subtends equal angles at two other points lying on the same side of the line containing the line segment, the four points lie on a circle (i.e. they are concyclic).
Theorem 8: Angles in the same segment of a circle are equal.
Given: A circle with centre O
Points P and Q on this circle subtends ∠PAQ = ∠PBQ at points A and B respectively.
To Prove : ∠PAQ = ∠PBQ
Proof: Let P and Q be any two points on a circle to form a chord PQ, A and C any other points on the remaining part of the circle and O be the centre of the circle. Then,
∠POQ = 2∠PAQ …… (i)
And ∠POQ = 2∠PBQ ……. (ii)
From above equations, we get
2∠PAQ = 2∠PBQ
Therefore, ∠PAQ = ∠PBQ Hence Proved
Theorem 9:If a line segment joining two points subtend equal angles at two other points lying on the same side of the line containing the line segment the four points lie on a circle.
Given:
AB is a line segment, which subtends equal angles at two points C and D. i.e., ∠ACB = ∠ADB.
To Prove:
The points A, B, C and D lie on a circle.
Proof:
Let us draw a circle through the points A, C and B.
Suppose it does not pass through the point D.
Then it will intersect AD (or extended AD) at a point, say E (or E’).
If points A,C,E and B lie on a circle,
∠ACB = ∠AEB [∴ Angles in the same segment of circle are equal]
But it is given that ∠ACB = ∠ADB
Therefore, ∠AEB = ∠ADB
This is possible only when E coincides with D. [As otherwise ∠AEB >∠ADB]
Similarly, E’ should also coincide with D. So A, B, C and D are concyclic.
Hence Proved.
Cyclic Quadrilaterals
A quadrilateral is called cyclic if all the four vertices of it lie on a circle.
They are also called inscribed quadrilaterals.
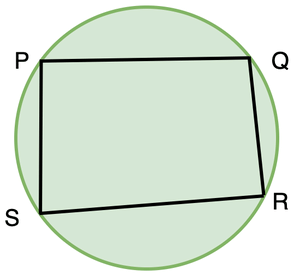
Theorem 10: The sum of either pair of opposite angles of a cyclic quadrilateral is 180º.
Given: PQRS is a cyclic quadrilateral with centre O.
To Prove:
∠PSR + ∠PQR = 180º.
∠SPQ + ∠QRS =180º. Proof:
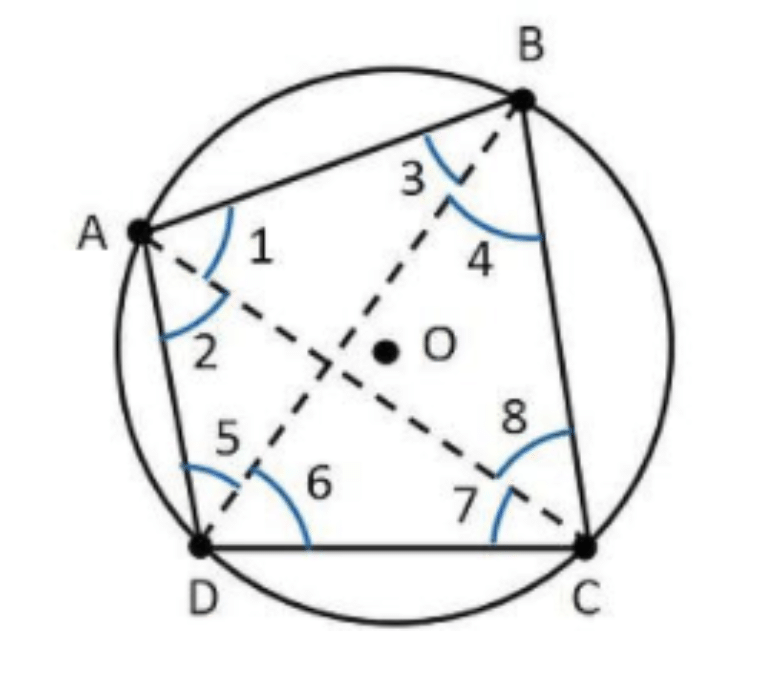
For chord AB, angles in same segment are equal. ∠5=∠8 Similarly, in chords BC, CD, and AD ∠1=∠6 ∠2=∠4 ∠7=∠3 Angle sum property of quadrilateral gives ∠A+∠B+∠C+∠D=360 ∠1+∠2+∠3+∠4+∠5+∠6+∠7+∠8=360 2(∠1+∠2+∠7+∠8)=360 ∠1+∠2+∠7+∠8=180 ∠BAD+∠BCD=180 Similarly we can prove that, ∠ABC+∠ADC=180
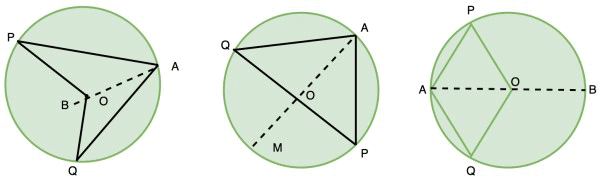
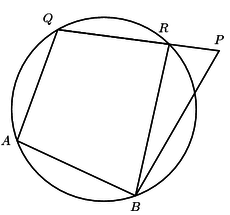
Example 3: In the figure below, BC is the diameter of the circle, ED is a chord equal to the radius of the circle. BE and CD when extended intersect at a point F. Prove that ∠BFC = 60°. Solution: In the figure, join AE, AD and EC. Triangle AED is an equilateral triangle. Therefore, ∠EAD = 60°. Now, ∠ECD becomes 30°. We know that ∠BEC = 90°. So, by the property of exterior angles of triangle, ∠BEC = ∠ECD + ∠BFC, 90° = 30° + ∠BFC ⇒ 60° = ∠BFC Hence, Proved.
Theorem 11: If the sum of a pair of opposite angles of a quadrilateral is 180º, the quadrilateral is cyclic.
Given: ABPQ is a quadrilateral, such that ∠ ABP + ∠ AQP =180 degree and ∠ QAB + ∠ QPB = 180 degree
To prove: The points A, B, P and Q lie on the circumference of a circle.
Proof: Assume that point P does not lie on a circle drawn through points A, B and Q.
Let the circle cut QP at point R. Join BR. ∠ QAB + ∠ QRB = 180 degree [given,sum of a pair of opposite angles of a quadrilateral is 180º]
∠ QAB + ∠ QPB = 180 degree [given]
∴ ∠ QRB = ∠ QPB
But this cannot be true since ∠ QRB = ∠ QPB + ∠ RBP (exterior angle of the triangle)
∴ Our assumption that the circle does not pass through P is incorrect and A, B, P and Q lie on the circumference of a circle.


 Solution: √7 is irrational.


 in p/q form is
 …(i)
…(i) ….(ii)
 = 5+4 – 4√5 – 5 – 4 – 4√5 = -8√5
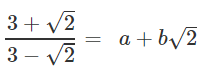 ,find the value of a & b.
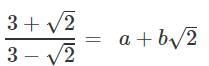 Rationalising LHS
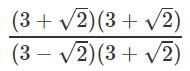
 ∴ a = 11/7 and b = 6/7
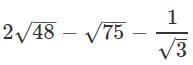
 = 15
= 15 in p/q form.
 10x =
10x =  1000x =
  1000x – 10x =
  –
–  990x = 15555x= 15555/990= 1037/66
 30/50 and 40/50∴ pick any five number between 30 and 4031/50, 32/50, 36/50, 37/50, 39/50
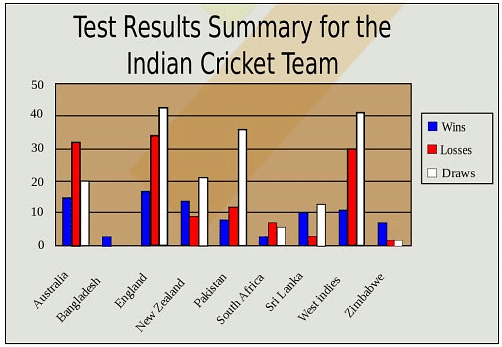


 Area=48×8×24×16=3842=384 m2

 and the major arc AB by
  where D is some point on the arc between A and B. When A and B are ends of a diameter, then both arcs are equal and each is called a semicircle.
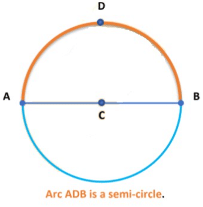
 In triangles KHL and JHI,